Bull and bear markets explained

If you’re an investor, you’ve probably come across the phrases ‘bull markets’ and ‘bear markets’. Indeed, over the last 12 months or so you may have seen both terms used to describe global stock markets!
But what are bull and bear markets? Why do they occur? And should we be worried about the current bear market (if that is what it is)?
Bear markets explained
A bear market is generally defined as a situation where the price of an investment falls at least 20% or more from its 52-week high. The US Securities and Exchange Commission say that a bear market occurs when a broad market index falls by 20% or more over at least a two-month period.
Whichever definition you use, the key factor here is a 20% fall, for example, in the FTSE 100 or similar index.
A bear market is typically caused by a loss of investor, business, and consumer confidence. As confidence diminishes, so does demand.
This loss of confidence can be triggered by a stock market crash, when share prices fall by around 10% in a day or two. This is exactly what happened in March, when the outbreak of the coronavirus rocked financial markets around the world. The FTSE 100 saw its biggest daily fall since 1987 during mid-March.
Bull markets explained
As you might expect, a bull market sees the price of an investment rise over an extended period – typically a rise of 20% or more. ‘Bulls’ are investors who buy assets in the expectation that the market will rise and whenever sentiment is ‘bullish’ it’s because there are more bulls than bears.
On August 22, 2018, the bull market became the longest-running in US history. Other significant bull markets include the period after World War II, and the period in the early to mid-1980s that ended on Black Monday.
Beware of the bear market rally
At the worst point in March, the value of the FTSE 100 index had fallen by around 35% from its 12-month high.
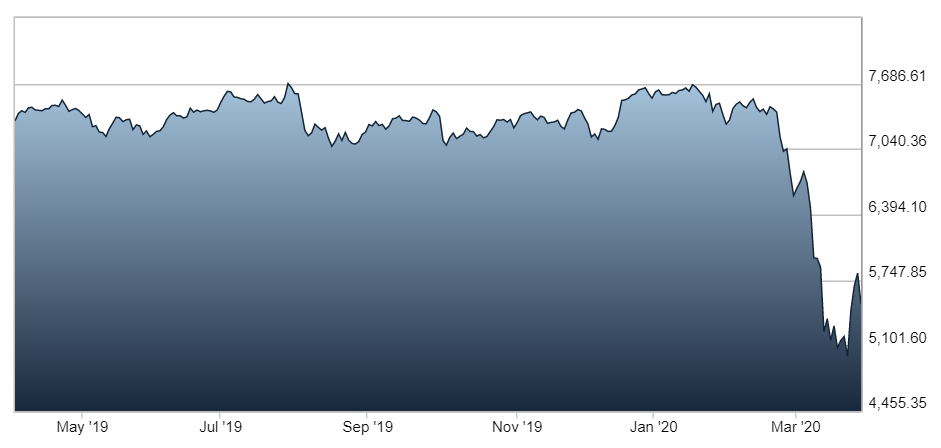
Source: London Stock Exchange
Since then, markets have rallied slightly. Experts call this a ‘bear market rally’ and they can last for days or even weeks.
These rallies can trick investors into thinking that the stock market trend has reversed, and that a bull market has started. However, it’s important to remember that nothing in the stock market is this simple! Even in a normal bear market, there will be days or months when the trend is upward. However, until it moves up 20% or more, it is still in a bear market.
Comparing bull and bear markets over time
Much has been made of the recent stock market falls that have essentially wiped out years of steady gains. However, the truth is that bull and bear markets tend to be very different from one another with bear markets lasting, on average, much less time than a bull market.
This chart below shows bull and bear markets in the UK over more than a century. You’ll see that while the average bull market lasts for almost eight years, the average bear market lasts for less than a year and a half. There have been just 16 ‘bear’ years since 1900, compared to 103 bull years.
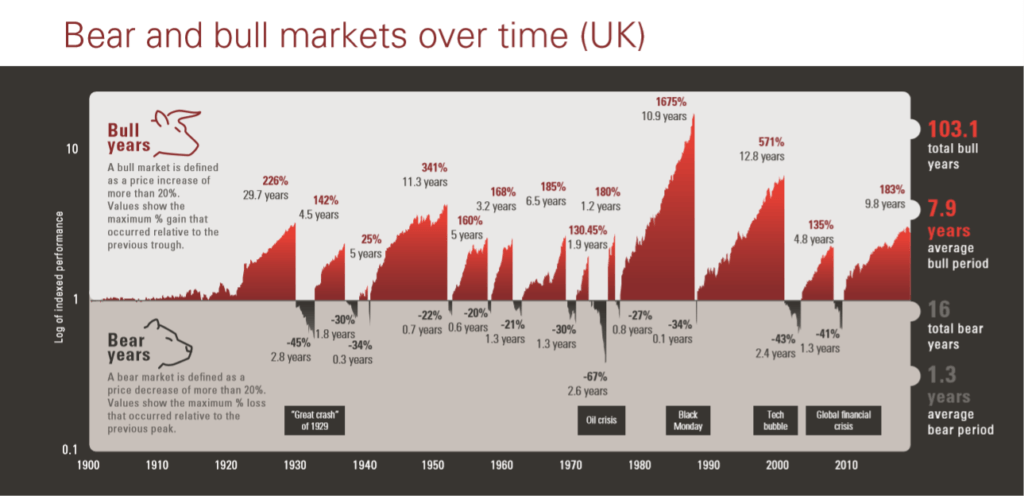
Notes: Calculations are based on FTSE All Share (GBP Total Return). A bear market is defined as a price decrease of more than 20%. A bull market is defined as a price increase of more than 20%. The plotted areas depict the losses/gains ranging from the minimum following a 20% loss to the respective maximum following a 20% appreciation in the underlying index. Time period: 31 January 1900 to 31 December 2018. Calculations based on monthly data. Logarithmic scale on y axis. Source: Global Financial Data.
Note that past performance is not a reliable indicator of future results. The value of investments, and the income from them may fall or rise and investors may get back less than they invested.
This chart comes to some slightly different bull and bear market durations, but its conclusion is the same: there are many more bull years than bear years.
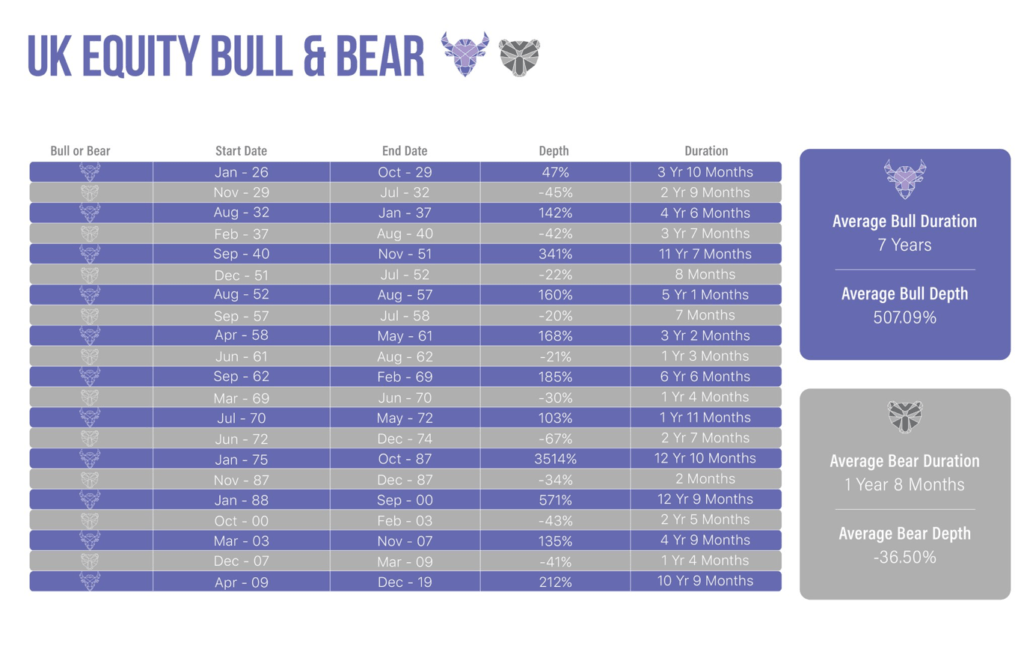
This chart is for illustrative purposes only. It does not constitute investment advice and must not be relied on as such. Transaction costs, taxes and inflation reduce investment returns. The portfolios are hypothetical and are re-balanced annually on the 1st of January. All investment income is assumed to be reinvested, unless otherwise stated. No transaction costs or taxation are included. Bull markets start from the lowest close reached after the market has fallen 20% or more, to the next market high. Bear markets start from when the index closes at least 20% down from its previous high close, through the lowest close reached after it has fallen 10% or more. Sources: UK Equities, UK FTSE All-Share Return Index (with GFD extension). Source: Timelineapp Tech Limited using data from Global Financial Data. Copyright© 2020. Timeline app Tech Limited. All rights reserved
Get in touch
So, what does all this mean? Over time, the stock market can fluctuate and there are times when indexes show a significant fall. However, in time, the markets have typically recovered, and any subsequent gains have generally outweighed losses.
Take the global financial crisis as a relatively recent example. The data shows that markets fell by 41% over a period of around 16 months. However, in the subsequent 129 months, markets rose by 212%. If you had pulled your money out of equities during the 2008/09 bear market and never returned, you would have missed out on these gains.
If you have questions about the current market volatility, please get in touch. Email info@depledgeswm.com or call (0161) 8080200.